LIVE CHART | POWERFULL FOREX ECONOMIC CALENDAR | FOREX MONITOR FROM GOFOREX


Wednesday, June 13, 2007

Dollar climbs on stronger retail sales


Dollar climbs on stronger retail sales
source

NEW YORK (MarketWatch) -- The dollar rallied to a four-and-a-half year peak against the yen Wednesday, after a government report showed U.S. retail sales rose much more than forecast last month.
The dollar briefly advanced against the euro, touching an 11-week high, after the Commerce Department said retail sales registered the largest gain in 16 months. The strong reading boosted expectations that the Federal Reserve will keep interest rates high.
The "robust results for May suggested that the recent soft patch in U.S. economic growth has bottomed and consumer-led spending is fueling [gross domestic product] growth back to the 3.5% area in [the second-quarter]," said Michael Woolfolk, senior currency strategist at The Bank of New York. "Bullish dollar sentiment has carried over from last week."
Chart of C_JPY
Late in New York, the euro stood at $1.3305, compared with $1.3307 late Tuesday, after sliding to $1.3261, the lowest level since March 26. The dollar was quoted at 122.74 yen, compared with 121.75 yen, after rising to 122.75 yen, the highest level since December 2002.
The British pound stood at $1.9726, compared with $1.9749. The dollar changed hands at 1.2451 Swiss francs, compared with 1.2423 francs. Read More


Tuesday, June 12, 2007

Dollar Sets New Multi-week High Versus Euro


(RTTNews) - The U.S. dollar rallied against the euro in the early deals on Tuesday in New York, but it saw uncertainty in direction during the mid-day deals. However, the pair continued higher in late trading, likely influenced by the Japanese current account data. Compared to the day's low of 1.3386, the pair has lately fetched as high as 1.3268. This is a 10-week high for the pair. If the dollar strengthens further, 1.325 will be a likely level of resistance in the near term.


USD/EURO


Friday, June 8, 2007

Dollar vs. Dow: Plenty of Reasons for Volatility to Continue Next Week


Written by Kathy Lien, Chief Strategist
source: http://www.dailyfx.com/

•Dollar vs. Dow: Plenty of Reasons for Volatility to Continue Next Week
•New Zealand Dollar Hits Fresh 25 Year Highs, Be Careful of Bottom Picking in USD/CAD
•Japanese Government Sees No Risk of a Major Carry Unwind

Dollar vs. Dow: Plenty of Reasons for Volatility to Continue Next Week
If you watched the stock market today, it is not hard to imagine what went on the currency market. For the past few months, we have either seen carry trades follow the ebb and tides of US stocks or the reverse (see our latest report on this relationship: EUR/JPY and the Dow – Separated at Birth?). The correlation stems from the fact that the yen has become the primary funding vehicle for investors looking to get into US stocks, making the carry trade the poster child of the risk seeking world. The 157 point rally in the Dow today has erased 79 percent of yesterday’s losses bringing carry traders back with a vengeance. The outlook for higher interest rates in countries like New Zealand has sent the NZD/USD to a fresh 25 year high. This very dynamic is what will limit the losses in carry trades even if this is the last hurrah in US stocks. The latest wave of dollar strength, which was limited to the Euro, British pound and Japanese Yen, was triggered by the intraday reversal in yields, the drop in oil prices and the stronger US trade balance. Ten year bond yields hit a high of 5.24 percent, but ended the day in negative territory. Oil prices slipped as the cyclone in the Middle East loses strength. We are also finally seeing the benefits of the weak US dollar. The trade deficit dropped significantly in the month of April as import demand subsided while export demand hit a record high. The increase in exports is the main reason why many economists including Federal Reserve Chairman Ben Bernanke are looking for stronger growth in the second half. In the week ahead, the US economic calendar is light, but US retail sales, producer prices and the Fed Beige Book report are always important. Don’t expect volatility to let up with consumer spending and inflation reports also due for release from countries like the UK and New Zealand next week.

New Zealand Dollar Hits Fresh 25 Year Highs, Be Careful of Bottom Picking in USD/CAD
The return of the carry has taken the New Zealand dollar to a fresh 25 year high against the US dollar and a new 17 year high against the Japanese Yen. The commodity currencies are the best performing currencies today as they shrugged off both dollar strength and commodity weakness. The market expects the Reserve Banks of Australia and New Zealand to raise rates again this year given the strength of economic data for the former and the hawkishness of the central bank for the latter. Australian home loans were released last night and this was just as icing on the cake for a country that has already report very hot GDP and employment numbers. The Canadian dollar benefited from the overall rally in the commodity currencies. The stronger trade surplus and housing numbers offset the weaker employment figures. USD/CAD dropped from 1.1550 to 1.10 in the month of April. The fact that loonie strength did not hurt trade that month means that it has a greater chance of doing so in May and June. Looking ahead, there are key releases from all 3 countries so expect the action to continue in those pairs. Traders should be wary of picking a bottom in USD/CAD before a daily close above 1.0750.

Japanese Government Sees No Risk of a Major Carry Unwind
The rally in the Dow exacerbated the rise in carry trades but those currency pairs already began to trend higher before the US stock market even opened. The initial sell-off in the Japanese Yen was triggered by the nonchalant attitude of the Ministry of Finance towards the carry trade. MoF Watanabe said that there is “no immediate risks of carry trade unwind” and that any unwind would be “small compared to the entire FX market.” The Japanese government is clearly not concerned about the Japanese Yen strengthening. In fact, they probably will welcome it since it automatically tightens the economy and therefore reduces the need for a premature interest rate hike. Despite the weakness in the Yen, companies are not sharing the wealth with the people in the country and as a result, growth has been tepid. Machinery orders for April increased less than expected. The Japanese economic calendar was very light this week but it will pick up significantly in the week ahead with the second release of GDP, CGPI, consumer confidence, the current account, and industrial production due for release. The Bank of Japan will be meeting to decide on monetary policy, but interest rates are not expected to be changed.

Euro Hit by Weak Data; Swiss National Bank Expected to Lift Rates Next Week
All around weakness in European data sent the Euro to a 2 month low. The currency market is cyclical and whenever a currency becomes too strong, we begin to see weakness in the economy, especially if the country is export dependent. The biggest downside surprise today was in German industrial production which fell by the biggest amount in 7 years. Even though the German trade balance was right in line with expectations, the surplus in both Germany and France deteriorated. This is a clear indication that the economy is hitting a plateau and is one of the main reasons why the ECB will postpone any further rate hikes to September at the earliest. The calendar is light next week. The only pieces of data that have the potential to move the Euro are Eurozone industrial production, consumer prices and trade. The more interesting story will be Switzerland, who we expect to raise rates to 2.50 percent.

Heavy Calendar Should Lead to Big Moves in the British Pound
Stronger economic data has driven the British pound higher against the Euro, Japanese Yen, and Swiss franc but unfortunately, that strength did not extend to the GBP/USD. As correctly forecasted by the increase in manufacturing PMI, industrial production grew by a more than expected 0.3 percent in the month of April. House prices also continued to accelerate bringing the annualized pace of growth up 8.5 percent from 8.4 in the month of May. The UK has one of the busiest calendars next week with producer prices, consumer prices, employment and retail sales due for release. So expect to see big moves in the British pound.

Read more


Dollar follows Treasury yield higher


Aussie dollar rallies to 18-year high; New Zealand surprises

By Wanfeng Zhou, MarketWatch
Last Update: 4:38 PM ET Jun 7, 2007

NEW YORK (MarketWatch) -- The dollar rose against other major currencies Thursday, boosted by higher Treasury yields and reports that North Korea might have fired several missiles.
Treasurys sold off sharply Thursday, thrusting the benchmark yield above 5% for the first time since August, on the heels of a global sell-off of government bonds triggered by foreign rate hikes. See Bond Report.
"The dollar found some support from flight-to-safety flows," said Charmaine Buskas, economist at Moody's Economy.com. "It also gained as yields on long-dated Treasurys continue to rise and are now above the 5% level for the first time in nearly 10 months."
"The consensus is that global growth remains healthy and suggests that rates elsewhere across the globe [with the exception of the U.S.] are headed higher," she said.
Chart of C_JPY
Late in New York, the euro fell to $1.3425, compared with $1.3504 late Wednesday. The dollar was quoted at 120.88 yen, compared with 121.04 yen.
The British pound stood at $1.9777 vs. $1.9929. The dollar also changed hands at 1.2246 Swiss francs, compared with 1.2161 francs.
The euro traded at 162.32 yen vs. 163.47 yen. The euro climbed to an all-time high at 164.60 yen on Tuesday. See currency rates.
The yen advanced, as a sharp sell-off in U.S. equities triggered some unwinding of carry trades - in which investors borrow low-yielding currencies, such as the yen, and reinvest in higher-return currencies and assets.
U.S. stocks fell sharply on Thursday, sending the Dow Jones Industrial Average down by over 140 points, as mixed May sales from the nation's retailers and lower jobless claims helped push the yield of a key benchmark bond above 5%, further challenging the attractiveness of stocks. See market snapshot.

Read More


Thursday, June 7, 2007

Yen Heads for Weekly Gain Against Euro as Global Stocks Slump


By David McIntyre and Kosuke Goto

June 8 (Bloomberg) -- The yen headed for the first weekly advance versus the euro in a month as a slump in global stock markets caused investors to sell higher-yielding assets they bought with money borrowed in Japan.

Japan's currency yesterday gained the most in 10 weeks after the Dow Jones Industrial Average had the biggest drop since April 13, pushing traders to pare so-called carry trades. Asian stock markets are likely to follow after American depositary receipts of the region's equities had the biggest decline in three weeks.

``The carry is going to come in for a bit of a pasting as Asian markets will be rattled,'' said Paul Milton, chief dealer at Societe Generale SA in Sydney. ``There will be yen strength.'' read more


Market Review


The US dollar (USD) ended the week little changed against the euro (EUR). Carry trade activities continued to dominate the FX market. As a result, USD strengthened modestly against low-yielding currencies (the yen and Swiss franc), and weakened against high-yielding currencies (Australian and New Zealand dollars). Most US economic data, recently released, were positive, and the US non-farm payrolls report released on last Friday was much better than market expectations.(HSBC Foreign Exchange) Read More


Wednesday, June 6, 2007

Oil turns higher despite gas swell


By Steve Hargreaves,
CNNMoney.com staff writer

Inventories, running low all year, jump by 3.5 million barrels, but drop in refining activity, flat crude stocks and Persian Gulf cyclone keep prices higher.

NEW YORK (CNNMoney.com) -- Oil prices turned higher Wednesday, shrugging off swelling gasoline supplies and instead focusing on a drop in refinery activity, flat crude stocks and a cyclone bearing down on the Persian Gulf.

U.S. light crude for July delivery rose 29 cents to settle at $65.90 a barrel on the New York Mercantile Exchange. Oil initially fell after the government reported the rising gasoline stocks.


In its weekly inventory report, the Energy Information Administration said gasoline supplies, closely watched in the summer driving season and running low all year, ballooned by 3.5 million barrels last week. Analysts were looking for a gain of 1.4 million barrels, according to Reuters.

Crude stocks rose by 100,000 barrels, while distillates, used to make heating oil and diesel fuel, increased by 1.9 million barrels. Analysts were looking for a gain of 300,000 barrels of crude and an 800,000-barrel rise in distillates.

But a decline in refinery activity supported prices. EIA said refineries ran at 89.6 percent capacity, a surprise drop from last week's 91.1 percent.

The average nationwide retail price for gasoline, as measured by the motorist organization AAA, hit a record high of $3.227 a gallon two weeks ago as a string of refinery problems throughout the winter helped push gasoline supplies to lows not seen in years.

But over the past few weeks, refineries have begun to come back online and gasoline stocks have grown, although they still remain well below normal for this time of year. Gas stood at $3.14 a gallon nationwide Wednesday.

Also in focus: Cyclone Gonu, churning past the mouth of the Persian Gulf.

Reuters said the cyclone, the strongest storm to reach Oman in 30 years, disrupted the country's crude exports of 650,000 barrels per day (bpd) for a second straight day - adding to supply worries that have underpinned the market.

It weakened on Wednesday to the equivalent of a Category One hurricane, from a maximum-force Category Five, en route to the Strait of Hormuz, a major Gulf oil export route, and then toward southeastern Iran.

The cyclone is expected to have a bigger impact on shipping in the Gulf rather than on Iran's oil facilities, which are concentrated inland and away from the storm's projected track.

An Iranian oil official told Reuters crude shipments of 2.4 million bpd from OPEC's second-biggest producer were not expected to be affected.

"We doubt the few days of export delays caused by the storm will, in the end, contribute much to the upside or create measurable disruptions to the system," Edward Meir of Man Financial Energy Group told the news agency.

Crude oil prices have risen over the past couple of weeks as tensions with Iran over its nuclear program increased and violence hit Nigeria in the wake of its presidential elections.

U.S. crude is now at the high end of its $55 to $65 range, where it has traded for the better part of a year after hitting an all-time trading high of $78.40 last summer. (CNN Money)


U.S. Economy: Productivity Slows, Labor Costs Rise (Update1)


By Joe Richter

June 6 (Bloomberg) -- U.S. worker productivity grew less last quarter than the government initially estimated and labor costs climbed, giving the Federal Reserve reason to remain concerned about inflation.

Productivity, a gauge of employee efficiency, rose at an annual rate of 1 percent, down from the 1.7 percent pace reported last month, the Labor Department said in Washington today. Labor costs increased 1.8 percent, three times the prior estimate.

The rise in labor expenses, which account for about two- thirds of the cost of producing a good or service, heighten the odds that companies will push up prices, economists said. The figures, along with signs that growth is recovering, make it even less likely that policy makers will lower interest rates.

``There are inflationary pressures coming from the labor market,'' said Julia Coronado, a senior economist at Barclays Capital Inc. in New York, who correctly forecast the gain in labor costs. ``Along with the downward drift in productivity, this will be a concern for the Fed.''

Economists had forecast a 1 percent rate of increase in first-quarter productivity, according to the median of 70 forecasts in a Bloomberg News survey. Unit labor costs, which are adjusted for efficiency gains, were projected to rise at a 1.3 percent pace.

The yield on the benchmark 10-year U.S. Treasury note fell to 4.96 percent as of 4:50 p.m. in New York, compared with 4.99 percent last yesterday.

GDP Revision

With today's report, Labor also revised figures for the fourth quarter that reflected, in part, last week's update on gross domestic product and personal income. Productivity rose at an annual rate of 2.1 percent in the fourth quarter, the same as previously estimated. Labor costs jumped 8.9 percent in the last three months of 2006, up from 6.2 percent.

Hours worked fell at a 0.4 percent pace last quarter, the biggest drop in almost four years, compared with a 0.3 percent decline initially reported and a 0.8 percent gain the previous three months. Output rose at a 0.6 percent rate last quarter, the smallest increase since the last three months of 2002.

Among manufacturers, productivity rose at a 2.4 percent rate in the first quarter, after increasing at a 1.9 percent rate the prior three months. Productivity at non-financial corporations, a measure watched by the Fed, rose at a 0.6 percent rate.

For all of last year, productivity rose 1.6 percent, the smallest increase since 1995. Labor costs in 2006 rose 3.3 percent, the most in six years. As recently as 2002, labor costs dropped by 0.5 percent.

Accounting Change

A change in how the government accounted for bonus payments and stock options last year explains the seeming first-quarter deceleration in labor costs compared with the previous three months, economists said. The Labor Department included bonuses in both the first and fourth quarters of 2006.

``The increasing importance of employee stock options as a factor affecting labor compensation data has made it harder to estimate unit labor costs and also made this variable much less reliable as an inflation indicator,'' Edward McKelvey, senior U.S. economist at Goldman Sachs Group Inc., said in a note to clients this week.

After improving from 2002 to 2004, worker efficiency has slid. Productivity rose 2.1 in 2005. The average increase over the previous three years was 3.6 percent.

In the 1990s, former Fed Chairman Alan Greenspan championed the idea that higher productivity rates would keep a lid on inflation even as the U.S economy was gaining strength and unemployment was low.

Rising Costs

Slowing efficiency gains and higher labor costs have raised concern that wage pressures and faster growth could prompt companies to raise prices, stoking inflation.

Economic growth is likely to pick up from the first-quarter pace that was the slowest in four years, Fed Bank of Kansas City President Thomas Hoenig and Fed Bank of Richmond President Jeffrey Lacker said in separate speeches today. While both said inflation remains a risk to the economy, Hoenig also said productivity is likely to improve as economic growth quickens through the year.

Fed Governor Randall Kroszner last week said the economic slowdown will ``prove transitory,'' while a low unemployment rate threatens to stoke inflation. The jobless rate was at 4.5 percent in the last two months after reaching a five-year low of 4.4 percent in March.

Goldman Forecast

Goldman Sachs yesterday abandoned its prediction the Fed will reduce interest rates this year. Goldman joined Merrill Lynch & Co. and UBS AG, who earlier this week revised their Fed forecasts after a government report on June 1 showed the economy added more jobs than expected last month.

Still, recent reports show price pressures have moderated. The Fed's preferred inflation benchmark, the personal consumption expenditures price index minus food and energy, rose 2 percent in the year to April, the smallest 12-month gain since February 2006, a government report last week showed.

Some companies are still managing to wring out efficiency gains by trimming their workforces.

Round Rock, Texas-based Dell Inc., the world's second- largest personal-computer maker, said last month it will cut about 8,800 jobs, or 10 percent of its workforce.

Job cuts will be across regions and units to ``eliminate redundancies, bureaucracy and activities,'' spokesman Bob Pearson said last week. (bloomber.com)


Tuesday, June 5, 2007

05.06.2007 - Retail sales in the euro area below expectations in April


The index of retail sales in the euro area rose by 0.2% in April, Eurostat, the Statistical Office of the European Communities reported today. In the preceding month the index of retail sales grew by 0.5%. The analysts estimated 0.4% increase in April.

The annual index of retail sales grew in April by 1.6%, compared with 2.6% increase in the preceding month. The expected annual increase was 1.9% in April.

The index of retail sales excluding food, drink and tobacco rose in April by 0.1% on month and 2.3% on year.

The increase of retail sales is a positive factor for national economy development and results in the increase of national currency rate. Oppositely, weak retail sales may contribute to euro rate decrease toward major currencies. (nortfinance)


05.06.2007 - U.S. services sector growing at best pace in a year


The nonmanufacturing side of the U.S. economy grew at the best pace in a year in May, the Institute for Supply Management reported.

The ISM nonmanufacturing index rose to 59.7% from 56% in April. It's the highest since April 2006.

Economists were looking for a pullback to about 55%. The index has been above 50% for 50 consecutive months.

The new orders index rose to 57.4% in May from 55.5% in April. The prices paid index rose to 66.4% from 63.5%. The employment index rose to 54.9% from 51.9%. (northfinance)


Sunday, June 3, 2007

Basic Explanation of Forex, from the forex.info


source:http://www.forex.info/index.php

Are you ready to join the thrill?

Forex trading, the highly attractive marketplace, with a daily volume of 2.5 trillion dollars, has become the largest arena on earth. It’s about time that you, like millions of other individual investors, join this market, which is accessible for everyone worldwide, around the clock, from any computer.

This Forex e-book has everything you need
This book shows you everything you need to know to start trading Forex. It addresses the reader at eye level, in a friendly and simple manner. Yet, it provides a professional study of the most popular techniques implemented today by Forex traders worldwide. This book offers useful and valuable background, including technical methods, trading tips, Forex glossary, chart reading, and financial indicators used in Fundamental Analysis.

A word about this e-book’s approach
This book reflects years of experience in Forex trading and Forex platform operation, parallel to Forex education, including seminars, printed publications and academic studies. Such experience was brought to this book, to provide all levels of traders the training and the essentials of Forex trading.

With the help of this guide, you will soon be ready to start trading Forex. In fact, you can start today, while beginning with small amounts and gradually obtaining the experience you need. We wish you success in your trading, and hope you find this book interesting, helpful and enjoyable.

Download the Book


Saturday, June 2, 2007

Fozzy Signal Indicator


This is the Fozzy signal indicator for metatrader4 just download by click the link on below

The properties of the indicator are:
  • RSIPeriod
  • BollPeriod
  • MAPeriod
  • bRequireBollingerCross - This is a nice modification I've put into the indicator to eliminate false crosses. It demands that on each cross both the MA and the Middle band will be crossed. Set on 1 if you want to use it, 0 if not.
  • SignalWidth - The width of the arrow on the chart. Default is 2.
Download Fozzy Signal Indicator for Metatrader4


TRADING WITH THE GUPPY MULTIPLE MOVING AVERAGE


This indicator was developed by Daryl Guppy. It is fully explained in TREND TRADING. Captures the inferred behaviour of traders and investors by using two groups of averages. Uses fractal repetition to identify points of agreement and disagreement which precede significant trend changes.

APPLICATION

Applied to understand the nature and character of the trend. Used to assess the degree and extent of trading activity. Excessive trading activity can destabilise strong trends. Trend analysis enables more effective selection of appropriate trading strategies such as breakout, trend continuation etc. Can be applied to long side and short side trading. Can be applied to intraday trading. Also used for longer term investment style analysis.


chart

TACTICS

  • Join established trends at points of price weakness

  • Join established trends breaking to new highs

  • Trade breakouts using rally dips and rebounds

  • Trade downtrend rallies as rallies rather than trend breaks

  • Recognise trend breaks as they develop

RULES

  • Degree and nature of separation in the long term group define trend strength and weakness

  • Degree and nature of separation in the short term group define the nature of trading activity.

  • Degree and nature of separation between the two groups of moving averages define the character of the trend.

  • Compression shows agreement on price and value.

  • Compression of both groups at the same time indicate major re-evaluation of stock and potential for a trend change

  • Trade in the direction of the long term group of averages

  • The relationships between the groups provide the necessary information about the nature and character of the trend.

  • Do not use as a moving average crossover tool

ADVANTAGES

  • Enables effective analysis of the trend environment

  • Improves selection of the appropriate trading tactics

  • Better understanding of trend strength

  • Effective evaluation of unusual price movements, such as dips and spikes

  • Effective understanding of trading activity and behaviour

DISADVANTAGES

  • Not effectively applied to trend less stocks

  • Cannot be applied to all trending stocks

  • Do not use as a moving average crossover signal


more detail download this link


Friday, June 1, 2007

Basic Guide to Understanding Elliott Wave


Ralph Nelson Elliott developed the Elliott Wave Theory in the late 1920s by discovering that stock markets, thought to behave in a somewhat chaotic manner, in fact, did not. They traded in repetitive cycles, which he discovered were the emotions of investors as a cause of outside influences, or predominant psychology of the masses at the time. Elliott stated that the upward and downward swings of the mass psychology always showed up in the same repetitive patterns, which were then divided into patterns he termed "waves".


The theory is somewhat based upon the Dow Theory inasmuch as the price movements move in waves. It was understood by the technicians at the time that because of the fractal nature of the markets, Elliott was able to break down and analyze the markets in much greater detail.
Elliott was able to spot unique characteristics of wave patterns and make detailed market predictions based on the patterns he identified. Fractals are mathematical structures, which on an ever-smaller scale infinitely repeat themselves. The patterns that Elliott discovered are built in the same way. An impulsive wave, which goes with the main trend, always shows five waves in its pattern. On a smaller scale, within each of the impulsive waves of the before-mentioned impulse, five waves can again be found. In this smaller pattern, the same pattern repeats itself ad infinitum. These ever-smaller patterns are labeled as different wave degrees in the Elliott Wave Principle. Only much later were fractals recognized by scientists.
In the financial markets we know that "every action creates an equal and opposite reaction" as a price movement up or down must be followed by a contrary movement. Price action is divided into trends and corrections or sideways movements. Trends show the main direction of prices while corrections move against the trend. Elliott labeled these "impulsive waves" and "corrective waves".
The interpretation of the Elliott Wave Theory is as follows:
  • Every action is followed by a reaction.
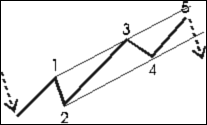
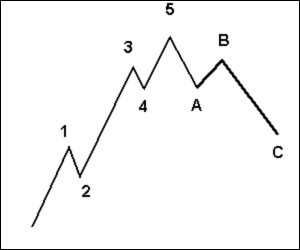
  • There are five waves in the direction of the main trend followed by three corrective waves (a "5-3" move).
  • A 5-3 move completes a cycle.
  • This 5-3 move then becomes two subdivisions of the next higher 5-3 wave.
  • The underlying 5-3 pattern remains constant, though the time span of each may vary.
Let's have a look at the following chart made up of eight waves (five up and three down) which are labeled 1, 2, 3, 4, 5, a, b and c.


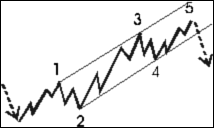
You can see that the three waves in the direction of the trend are impulses, so these waves also have five waves. The waves against the trend are corrections and are composed of three waves.


In the 70s, this wave principle gained popularity through the work of Frost and Prechter. They published a legendary book on the Elliott Wave, entitled "The Elliott Wave Principle – The Key to Stock Market Profits". In this book, the authors predicted the bull market of the 1970s, and Robert Prechter called the crash of 1987.


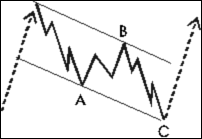
The corrective wave formation normally has three, in some cases five or more, distinct price movements, two in the direction of the main correction (A and C) and one against it (B). Waves 2 and 4 in the above picture are corrections. These waves have the following structure:


Note that the waves A and C go in the direction of the shorter-term trend, and therefore are impulsive and composed of five waves, which is shown in the picture above.